


The Russell 2000 ETF triggered a bearish trend signal this week and continues to underperform S&P 500 SPDR, which remains with a bullish trend signal. Today’s report shows the Keltner Channel signals in each. SPY is currently correcting within an uptrend and pullbacks within uptrends are opportunities.
TrendInvestorPro tracks trends and pullback opportunities with our comprehensive reports and videos. Click here to take a trial and gain full access.
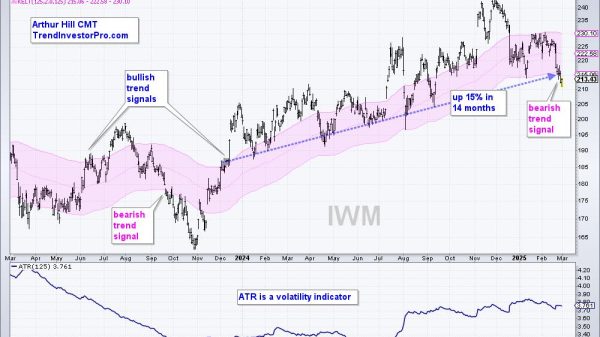
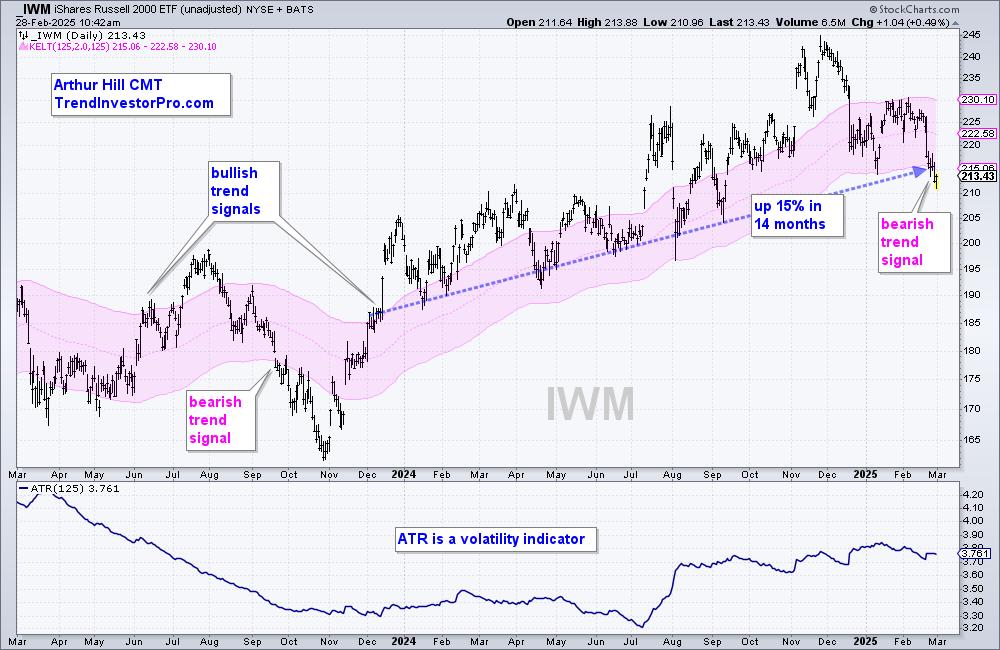
A Keltner Channel is a volatility band based on an exponential moving average and Average True Range (ATR). ATR is a volatility indicator developed by Welles Wilder, creator of RSI. I am using a 125-day EMA and setting the outer lines 2 ATR(125) values above and below. These long-term parameters are better suited for trend-following signals. A price move above the upper line signals a volatility breakout or uptrend, while a move below the lower band signals a downtrend.
The chart below shows the Russell 2000 ETF (IWM) with a bullish trend signal in mid December as it broke out of the Keltner Channel. This signal lasted around 14 months and ended with a break below the lower line in late February. IWM gained around 15% for this signal, which is not bad for 14 months. This is in the past because IWM is now in a downtrend and below its pre-election levels.

The bottom window shows the Average True Range (ATR) for reference. ATR is an average of the True Range over a given period of time. Wilder used the High, Low and Close over a 2 day period to calculate True Range. Note that this indicator is based on point changes, not percentage changes. This means we cannot compare values across charts. ETFs with higher price values, such as SPY (~586), have inherently higher ATR values than ETFs with lower price values, such as IWM (~215).
The next chart shows SPY with a Keltner Channel breakout with a big surge in November 2023. SPY seemed overbought when the bullish signal triggered in mid November, but the ETF did not pause until April 2024. SPY remains in an uptrend and is up around 30% in the last 15 months. Most recently, SPY declined into the Keltner Channel to test the 125-day EMA. This is considered a correction within an uptrend and a potential opportunity.

SPY is clearly preferred over IWM. First, SPY’s gain since the Kelter breakout was twice as large (relative strength). Second, SPY remains in an uptrend and IWM reversed its uptrend. Large-caps are still the place to be in this market. Small-caps show relative and absolute weakness, and should be avoided.
TrendInvestorPro tracks trends and pullback opportunities with our comprehensive reports and videos. Click here to take a trial and gain full access.
/////////////////////////////////////////////////